Water Activity on Specialty Green Coffee – we’ve compiled a summary of the coffee water paper by cafe imports to help you assess the quality of your beans and the expected standards, especially if you’re buying coffee (We’d recommend trying all types!).
Its time to take over the reigns and become the most sought-after coffee expert by getting certified at our Barista Training Institute In Australia.
What Is The Nature of Coffee?
Like humans, coffee beans have different characteristics based on the regions that they’re grown in. Furthermore, the water used to make coffee in different regions can impact taste based on the mineral content in that region.
How Is The Quality Of Coffee Green Coffee Beans Determined?
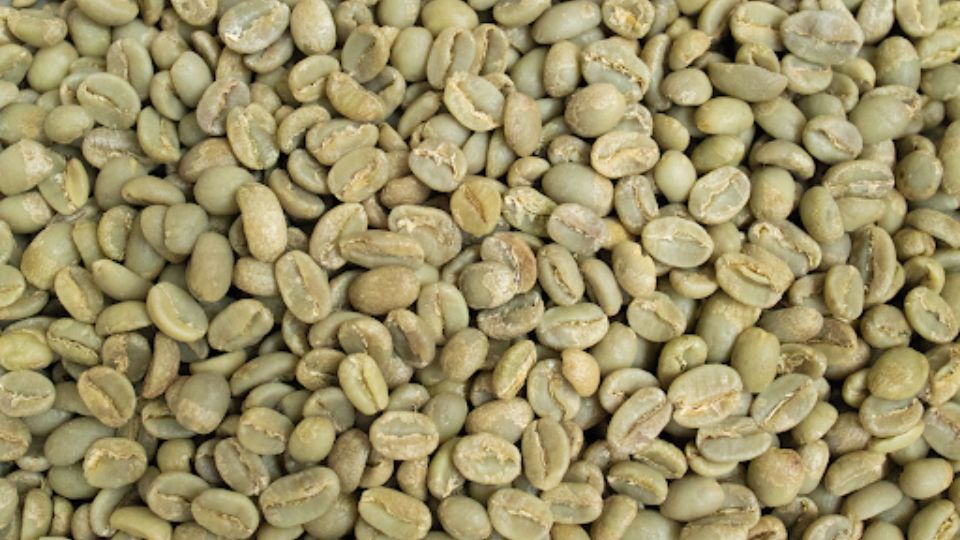
The hulled green beans are sorted over screens with various-sized holes to determine the quality of the green coffee beans. The amount of beans still in each screen is weighed, after which the percentage of the total is noted. After that, the coffee is roasted and cupped in order to assess its qualities.
The cafe imports team spearheaded by Ian Fretheim discusses, on the basis of an ongoing multi-year observational study, as well as a number of small-scale trials set up along the road, many characteristics of water activity in specialty green coffee beans. The researchers conducted these tests while compiling its bigger 25,000-point dataset on water activity in green coffee beans.
The team has taken around 25,000 water activity measurements in the past six years. 10,000 of those measurements were longitudinal, which means they were taken over time from the same coffees. The water activity (Aw) level of speciality coffee is currently 0.7000 Aw (Fretheim).
Get trained at one of Australia’s Top Barista Training Institutes to enter the barista world and become a trained expert in coffee making.
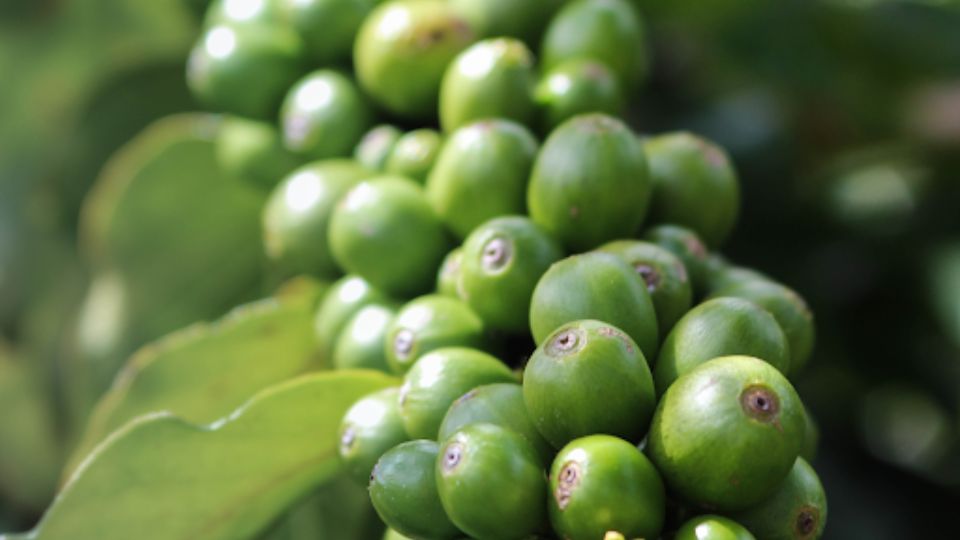
What Is Specialty Green Coffee?
The highest grade of beans, Grade 1 Coffee, requires that the beans have no primary defects and 0 to 3 full defects, with a limit of 5% over and below the designated screen size.
These beans must have a particular characteristic during cupping in one of the categories of taste, acidity, body, or scent, and they must be free of cup flaws and taints. Furthermore, there must be no “Quakers”—beans that are underripe or have been roasted improperly—in these green coffee beans.
In the coffee industry, “speciality coffee” refers to coffee that receives a cupping score of 80 or more and a Grade One green grading score.
Grade One Green Coffee
Grade One green coffee has 0–3 complete (secondary) flaws and no primary problems. There can be no quakers (unripened beans) during cupping, and the coffee must be free of flaws and taints. Furthermore, the moisture content should range from 9 to 13%.
Coffees scoring 80 or higher have flavourful characteristics that are complemented by additional enjoyable qualities, like a silky mouthfeel or lively acidity. Depending on the region and level of roast, each coffee will have a different flavour profile and grade.
About Green Coffee Extract
- Green coffee bean extract has been around for a long time. As part of the decaffeination process, it is created. It is made by steeping raw, unroasted coffee in water
- The Swiss Water Method of decaffeinating coffee, an all-natural process that has only been utilised commercially since the 1980s, uses green coffee bean extract
- Green coffee extract has been used successfully for up to 12 weeks in doses of up to 1000 mg daily. Svetol, Naturex, a particular green coffee extract, has been used safely in dosages up to 200 mg five times per day for up to 12 weeks
- Caffeine is present in green coffee, albeit in smaller quantities than in ordinary coffee. One cup of green coffee has between 25 and 50 percent less caffeine than one cup of normal coffee
- With that being said, at least one study used doses of up to 400 mg of green coffee extract twice daily, reporting no negative effects
- Chlorogenic acid molecules, which are tiny phenolics coupled to quinic acid, are frequently seen as the primary active ingredient of green coffee extract accounting for up to 42.2% of all phenolics and 7–12 grammes per 100 grammes before processing
Moisture Content In Specialty Green Coffee
Moisture content should be one of the first things you evaluate while evaluating green coffee beans. It typically makes up around 11% of the weight of green coffee and can affect a variety of qualities, including acidity and sweetness, aroma, and mouthfeel.
Green coffee beans can easily absorb moisture when exposed to the atmosphere during storage because of their extremely hygroscopic matrix. Studying the effects of water content and condition on the textural characteristics of green coffee beans may be quite interesting in regard to the energy required for grinding.
Additionally, roasted coffee beans may be used in foods like chocolate and candies, where brittleness is regarded as a key component (Szczesniak, 1990).
What Is Water Activity and How Is It Related To Moisture Content?
Yes. Water activity is closely related to moisture content but are not the same. The amount of water that is free, or unbound, and hence accessible to microorganisms for utilisation in development is indicated by the term “water activity,” or aW.
As a result, it is crucial for food safety. Below a particular water activity level (aW)—0.90 for the majority of harmful bacteria, 0.70 for spoilage moulds, and 0.60 for other microorganisms—microorganisms cannot thrive.
Water activity is frequently the most crucial component, even if temperature, pH, oxygen availability, and several other parameters might affect whether an organism will develop in a product and at what rate. Water activity plays an important role with regard to the chemical and physical qualities of unroasted coffee beans and the way it interacts with other microorganisms.
Consider for a moment that you are a producer of coffee. As part of your quality programme, you have been measuring moisture content at 12% or less. As of right now, you are instructed to measure water activity at 0.7000 Aw. You manage to raise the tens of thousands of dollars required to purchase a water activity meter, and you begin collecting data. Do you see anything?
If you’re not in an environment-controlled facility or using a highly expensive instrument, you’ll notice that measurements made in the morning and those obtained at night differ from one another.
Which reading from this list should you use? Will choosing the incorrect measurement harm your coffee? You can also observe that your coffees have well over 12% moisture at 0.7000 Aw.
In actuality, they are typically much nearer 14%. Are you happy that you can now remove your coffees from the drying process 2% sooner? Buyers, will they accept these? Or do you question why you were instructed to spend a big amount of money on a water activity metre to measure something you had previously been doing for years, consistently and with a sizable margin for error?
Browning Reactions As A Result Of Water Activity
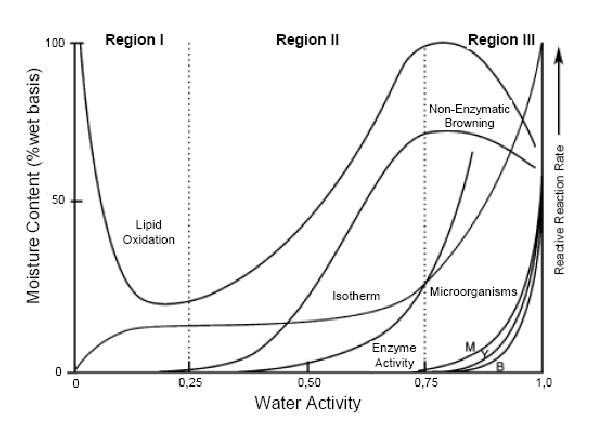
Consider an apple that you bite into and leave outside for a while. It takes less than an hour for it to oxidize and brown. The Water Activity Stability Diagram illustrates how the Maillard reaction can also cause food to deteriorate.
According to Pokorny et al. (1975), the Maillard process can occasionally begin in green coffee beans that are held in relatively warm and humid environments, resulting in a browning response (Flament, 38).
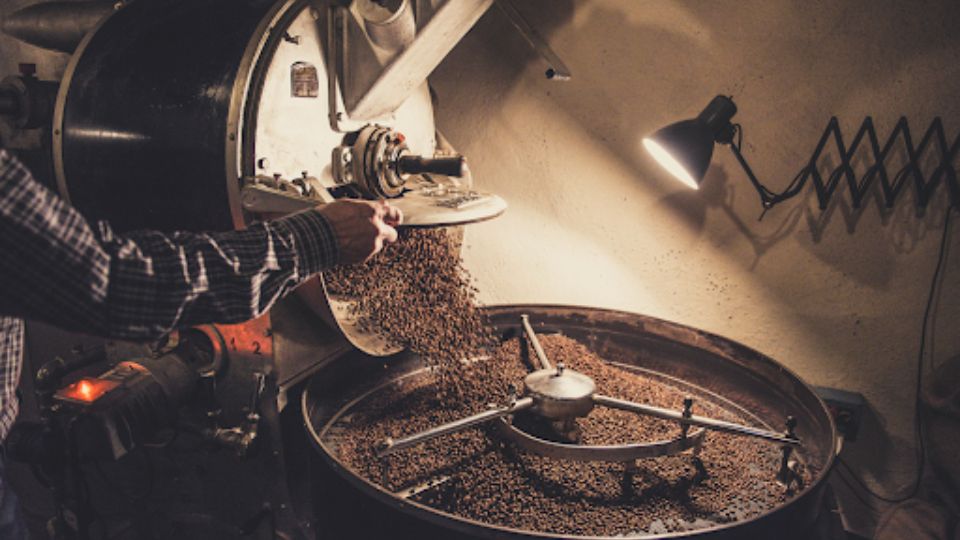
As roasting proceeds, the Maillard reaction and caramelization processes take place in an environment of comparatively high heat and low water activity.
Samples from various unroasted coffee beans were taken to measure the Aw levels. Another trial conducted included manipulating the water activity of various samples and it is interesting to look at what happens when they controlled the coffee variable and changed the aw.
By examining correlation data between Agtron output and Aw input, they could start their investigation into water activity and browning in roasting. The only observed origin where Aw appeared to explain Agtron by more than 10% (12.6%) was Kenya. Realistically, the Kenya figure appears to be very random, with a loose cluster of low Aw-low Agtron data driving the larger connection and model fit.
They then examined Agtron’s regression by water activity. Agtron and water activities have a 23.5 percent association. The positive association suggests that Agtron increases slightly along with rising water activity. This generally meant that roasts grew lighter as water activity rose.
It’s important to remember that these statistics were obtained from uniform time-temperature roast profiles. This meant that the application of the roasting machine was enough to make a certain coffee follow a pre-set temperature-at-time series.
This test examined how coffees reacted when forced to reach the same roast temperatures at the same roast timeframes rather than how they behaved when they were given the same roast input.
Water Activity and Roasting
The team looked into the possibility that the drastic change from room temperature to hot roaster was such a shock to the coffee-Aw system that it caused a realignment in water activity levels, but they were unable to find a significant correlation between water activity in room-temperature coffee and its subsequent degree of browning under controlled roast conditions.
According to this notion, a “true” browning-inducing Aw level would be attained right before the roaster Maillard processes started. It was thought improbable that this level would be close to 0.600 or higher, especially when compared to green data, because more moisture equates to increased water activity in specialty coffee. However, it was also thought that coffees with higher Aw just as browning started would have shown more browning under controlled roasting circumstances.
The Trial
Samples from a wide range of sources, with a variety of water activity and moisture levels, processing techniques, grade levels, and coffee ages represented, were chosen for convenience.
At 290 (143oC), 300 (149oC), and 310 (154oC) degrees Fahrenheit, they obtained three samples from each roast in succession. To signal the start of the Maillard process, these temperatures were used. The temperature of the trial roast drop was 424F (218oC).
Results
Some coffees’ Aw levels stay rather steady as they transition from room temperature (68oF/20oC) to the Maillard phase of roasting (290oF), while others experience a substantial reduction. Colombia P10939, the sample with the highest Aw, falls precipitously before levelling off and coming in the middle of the group. Sumatra P11086, the second-highest Aw sample, keeps its water activity above average to 310oF before dropping to the lowest of the bunch, which is also tied with Brazil P9849, the third-lowest initial Aw coffee.
Manipulating Water Activity
The four conditions used in this methodology were:
- Heat
- Bath
- Dry
- Control
Heat – They used transparent plastic containers for the thermal condition, placed the samples in the identical trays, and placed the trays in a window with natural light.
Bath – They placed coffee samples on trays into containers with water in the bottom that were only lightly closed for the Bath condition. Water was not allowed to come into touch with the coffee samples.
Dry – The identical setup as for the other conditions was employed for the dry condition, but at that time, diatomaceous earth (deposits from fossil remains) was added as a layer at the bottom of the container as a desiccant.
Control – The coffee alone was the condition for this one.
Seven samples were then used to run each condition. Seven more control samples were also produced, and this time they were simply stacked in the same trays and containers as the others, away from heat and light, and with no other alterations.
Findings
Samples from Bath underwent significantly less overall browning than those from the other environments. When tested as whole beans and when measured as ground beans, the Bath samples were less browned than the others. The biggest variation between whole bean and ground measures was found similarly in the Bath samples.
The most plausible explanation is that the roasting environment was affected by enough moisture, as seen above. They couldn’t rule out the potential that the higher Aw would have a more fundamental effect on the coffee itself.
At greater Aw levels in storage, reaction rates for things like oxidation and enzymatic activity rise. While in storage, these may have a direct impact on the roast browning substances in coffee. It would take more extensive testing to investigate this concept.
It seems that higher Aw and moisture coffees may brown more slowly and to a lesser extent under the same roaster input circumstances. It is challenging to spot a pattern under the same roaster profile settings.
The trend that showed implied that coffees with more Aw and moisture at the start could have been more resistant to browning. Comparing the two could conclude that these coffees demanded more effort to produce the same level of browning as coffees with lower Aw and moisture.
Water Activity and Lipid Oxidation
What Is Lipid Oxidation?
Lipid oxidation, sometimes called rancidity, is an intricate series of free radical interactions between fatty acids and oxygen. Free radicals, which were intermediate results of lipid oxidation, and reactive aldehydes, which are end products, may interact with and negatively alter the characteristics of other food components such as proteins, carbohydrates, pigments, and vitamins.
Numerous variables, including fatty acid composition, the presence of prooxidants and antioxidants, the type of lipid (triacylglycerols, phospholipids, and others), and storage conditions, such as temperature, light, oxygen availability, and water activity, all affect the reaction mechanisms and rate of lipid oxidation.
Because lipid oxidation might result in odd flavours, it is crucial to prevent lipid oxidation in green coffee. Trans-2-nonenal (T2N) is a typical substance in this group. Linoleic acid, the “most important acid in the lipids in coffee,” is oxidized to become T2N.
A strong odorant known as trans-2-nonenal smells like paper, moist cardboard, cedar, or wood. It can have a high quantities fragrance akin to green melon or cucumber.
Shelf Stability
We’re nearing our conclusion of predicting if Aw can sustain shelf life towards the end of this study conducted by cafe imports. It was noted that high water activity lead to low shelf life storage, so coffee samples were collected at the post-shipment arrival and storage stage.
They started by looking at the same general categories of water activity as they did for the Trans-2-nonenal question. The target descriptors in this instance are average and absolute score change.
They observed a similar pattern if they restricted their search to consider the score change that only happened between one variable and the other variable. Lower Aw coffees lost on average of less points while also being less volatile.
The standard deviation of score change is another indicator they might examine for volatility. This allowed them to see how varied the values of the score change are around our mean score change.
How Aw Behaved Overtime
The warehouse conditions led to the condensation of coffee between a certain range also causing the average results of the large samples to be inaccurate. The standard deviation of the change in water activity is fairly significant. They discovered a primary working range of 0.114 Aw if their 1 standard deviation range for the Aw in green coffee was between 0.497 Aw and 0.611 Aw.
It was significant, among other, things because the negative effects of water activity that were seen in green coffee are irreversible. Once lipids have oxidized, they couldn’t simply be reversed by restoring optimum water activity. Water activity that decreased could have re-inhibited mould growth, but Aw reductions did not kill or eliminate the mould. The presence of water in an ideal zone in a PSS does not guarantee that the coffee the sample represents would remain there.
This result was significant for another reason—it called into question the accuracy of a single-point water activity measurement made of, say, a sample sent from Colombia to Minneapolis.
Long-term results showed that lower Aw coffees had outperformed higher Aw coffees in some respects and to some extent, but this did not guarantee that any specific low-Aw pre-shipment coffee would perform as predicted.
What Are The Main Takeaways For Roasters?
The shipment period is a significant obstacle for both specialty coffee and their desire to utilise water activity. Although they were extremely infrequent in specialty coffee, the upper and lower quadrant of the water activity range were nevertheless present in coffees exposed to high heat or humidity (or sharp variations in either) during milling or shipping.
It merely indicated that they were unobservant of them. The interval between the pre-shipment sample and the arrival could be as long as four months. A water activity could only go so far in guaranteeing a safe arrival.
While water activity monitoring during shipping might have been impractical, knowledge about the correlation between coffee Aw and ambient temperature and humidity might be utilised to guide the creation of a best practise system for shipping coffee. This issue merits additional research.
It would definitely be putting the wagon before the horse to push for water activities to turn into a standard throughout the industry. For those that can’t afford it, don’t need it now, or would probably be unable to use it properly, it would impose an expensive, poorly understood measurement with limited application benefit. It would be preferable to apply what they understand about Aw in green coffee to improve standards and, ideally, create useful best practises for processing, drying, shipping, and storing.